|
|
NIRS-SPMRevision History : Ver. 4_r1 (PDF)
NIRS-SPM is a SPM (http://www.fil.ion.ucl.ac.uk/spm/) and MATLAB-based software package for statistical analysis of near-infrared spectroscopy (NIRS) signals, developed at the Bio Imaging Signal Processing (BISP) lab. at KAIST in Korea. 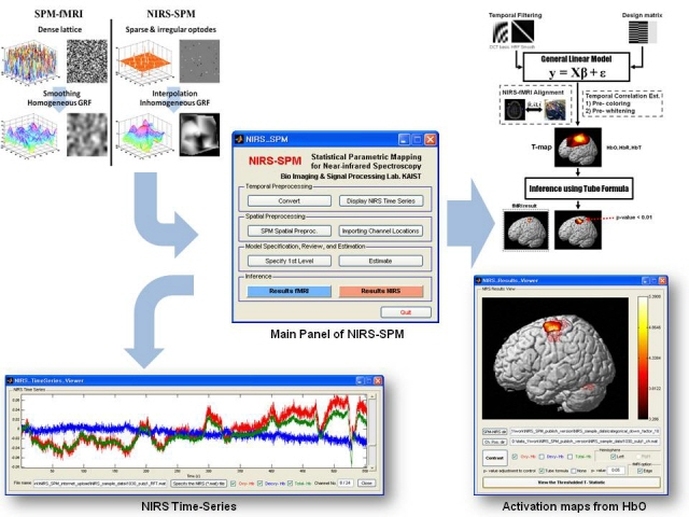
Based on the general linear model (GLM), and Sun's tube formula / Lipschitz-Killing curvature (LKC) based expected Euler characteristics, NIRS-SPM not only provides activation maps of oxy-, deoxy-, and total- hemoglobin, but also allows for super-resolution activation localization. More details are described in Ye et al., 2009 and Li et al., 2012. To remove the unknown global trends due to breathing, cardiac, vaso-motion, or other experimental errors, NIRS-SPM provides a wavelet-minimum description length (MDL) detrending algorithm (Jang et al., 2009). In addition, we have developed a method to estimate cerebral metabolic rate of oxygen (CMRO2) without hypercapnia by using simultaneous measurements of NIRS and fMRI (Tak et al., 2010). Using the optimization framework, many assumed parameters such as baseline hemoglobin concentration and hypercapnia can be readily estimated, which promise more accurate estimation of cerebral blood flow (CBF) and CMRO2.
Some specific features of the NIRS-SPM software package are as follows:
NIRS channel positions in real coordinates obtained from a 3D digitizer are localized onto the cerebral cortex of an anatomical MR image using Horn's algorithm (Horn, 1987). At least three measured real coordinates of reference positions, such as a marker capsule, nasion, and inion, are necessary to elicit the relationship between the MR coordinates and real coordinates in the 3-D digitizer. Real coordinates of reference positions and optodes should be saved in a Microsoft Excel 97-2003 file format (.xls) or a text file format (.txt). Specifically, column indexes are x, y, and z coordinates, respectively. (Please refer to the sample Excel or text file.) NIRS-SPM provides several channel configurations such as: 1) OXYMON MKIII 4x4 (1set), 2) ETG 4000 3x11 (1set), 3) ETG 4000 4x4 (2sets), 4) ETG 4000 3x5 (2sets). - Stand-alone NIRS The spatial registration of NIRS channels to MNI space with MNI coordinate input is available. NIRS-SPM provides two methods for receiving MNI coordinates: 1) manual input of MNI coordinate, 2) choice of MNI coordinates from SPM template images. Also, NIRS-SPM allows the spatial registration of NIRS channels to MNI space without MRI using NFRI' fNIRS tools (Singh et al., 2005).
NIRS-SPM provides both precoloring and prewhitening method. In our data set, we showed that precoloring is more appropriate for estimating temporal correlation of NIRS data than the prewhitening method. Hence, we recommend using the precoloring method (See Ye et al., 2009). In addition, channel-residual covariance estimation was modified to consider channel-wise least square residual correlation (See Li et al., 2012).
Software Requirements - MATLAB (Mathworks, Natick, MA, http://www.mathworks.com). The Image Processing Toolbox is required. - SPM5 or SPM8 (Welcome Department of Cognitive Neurology in London). It can be freely downloaded from: http://www.fil.ion.ucl.ac.uk/spm/software/ Hardware Requirement NIRS-SPM has been developed and tested on Intel(R) Pentium(R) 4 CPU 3.00 GHz, 2.00 GB RAM. However, NIRS-SPM will work on any computers with MATLAB 7 with approximately 2.0 GB RAM. Note that the process for estimating temporal correlations requires large amount of memory. Depending on total recording time, more than 2.0 GB RAM will be required. Sample Datasets - NIRS data files: Several sample files from OXYMON MKIII, ETG4000 (1set, 2set), ImagentTM system, DYNOT-232, Spectratech OEG-16, and FOIRE-3000 are provided. - Spatial registration files: Real coordinates of reference positions/optodes and MNI coordinates of 12 optodes and corresponding 14 channels (for stand-alone NIRS) are provided. - Ch_config folder: Folder that contains several channel configurations. - T1 MRimage folder: Folder that contains anatomical (normalized) MR images and segmented gray/white matter images. - fMRI result folder: Folder that contains fMRI-SPM result files. fMRI data was simultaneously measured with NIRS data. - CMRO2_Est folder: Folder that contains sample dataset for estimating the CMRO2 without hypercapnia from simultaneous fMRI and NIRS measurements. Acknowledgement - This research is supported by the IT R&D program of MKE/IITA [2008-F-021-01]. This research is also supported by the Korea Science and Engineering Foundation (KOSEF) grant funded by the Korea government(MEST) (No. 2009-0081089). Updates Although we have endeavored to develop NIRS-SPM as accurate and high quality software, there remains the possibility of some bugs. Please assist us by reporting any bugs to [email protected]. Reported bugs will be fixed in the next version of the NIRS-SPM. User's Guide NIRS-SPM User's Guide, December 16th, 2011 (PDF). Download and Installation Instructions
In order to download NIRS-SPM software and sample data sets, registration is required. After uncompressing NIRS_SPM_v4_r1.zip, 'NIRS_SPM_v4_r1', 'batch_file', 'nfri_functions', 'Sample_data', and 'Documentation' directories will be created. Then, add 1) NIRS-SPM_v4_r1 directories with sub-folders, 2) spm5 directories with sub-folders in the MATLAB path. Copyright (c) 2012, Sungho Tak and Jong Chul Ye, KAIST
NIRS-SPM is free software; you can distribute it and/ or modify it under the terms of the GNU General Public License (GPL) as publishing by the Free Software Foundation, either version 3 of the License, or any later version. For the copy of the GNU General Public License, see (http://www.gnu.org/licenses/). Additional Note from Authors You can get the software freely - including source code - by downloading it here. We appreciate if you cite the following papers in producing the results using NIRS-SPM toolbox. [1] Ye, J.C., Tak, S., Jang, K.E., Jung, J.W., Jang, J.D., 2009. NIRS-SPM: Statistical parametric mapping for near-infrared spectroscopy. NeuroImage 44, 428-447. [2] Jang, K.E., Tak, S., Jung, J.W., Jang, J.D., Jeong, Y., and Ye, J.C., 2009. Wavelet-MDL detrending for near infrared spectroscopy (NIRS). J. Biomed. Opt. 14, 1-13. [3] Tak, S., Jang, J., Lee. K., and Ye, J.C., 2010. Quantification of CMRO2 without hypercapnia using simultaneous near-infrared spectroscopy and fMRI measurements. Phys. Med. Biol. 55, 3249-3269. [4] Tak, S., Yoon, S. J., Jang, J., Yoo, K., Jeong, Y., and Ye, J.C., 2011. Quantitative analysis of hemodynamic and metabolic changes in subcortical vascular dementia using simultaneous near-infrared spectroscopy and fMRI measurements. NeuroImage 55, 176-184. [5] Li, H., Tak, S., and Ye, J.C., 2012. Lipschitz-Killing curvature based expected Euler characteristics for p-value correction in fNIRS. J. Neurosci. Meth. 204, 61-67. Q&A Forum |
|
ABOUT US
Our research activities are primarily focused on the signal processing and machine learning for high-resolution high-sensitivity image reconstruction from real world bio-medical imaging systems. Such problems pose interesting challenges that often lead to investigations of fundamental problems in various branches of physics, mathematics, signal processing, biology, and medicine. While most of the biomedical imaging researchers are interested in addressing this problem using off-the-self tools from signal processing, machine learning, statistics, and optimization and combining their domain-specific knowledge, our approaches are unique in the sense that I believe that actual bio-medical imaging applications are a source of endless inspiration for new mathematical theories and we are eager to solve both specific applications and application-inspired fundamental theoretical problems.
|
CONTACT US
Bio Imaging. Signal Processing & Learning
Graduate School of AI KAIST 291 Daehak-ro, Yuseong-gu Daejeon 305-701, Korea Copyright (c) 2014, BISPL All Rights Reserved. |

|